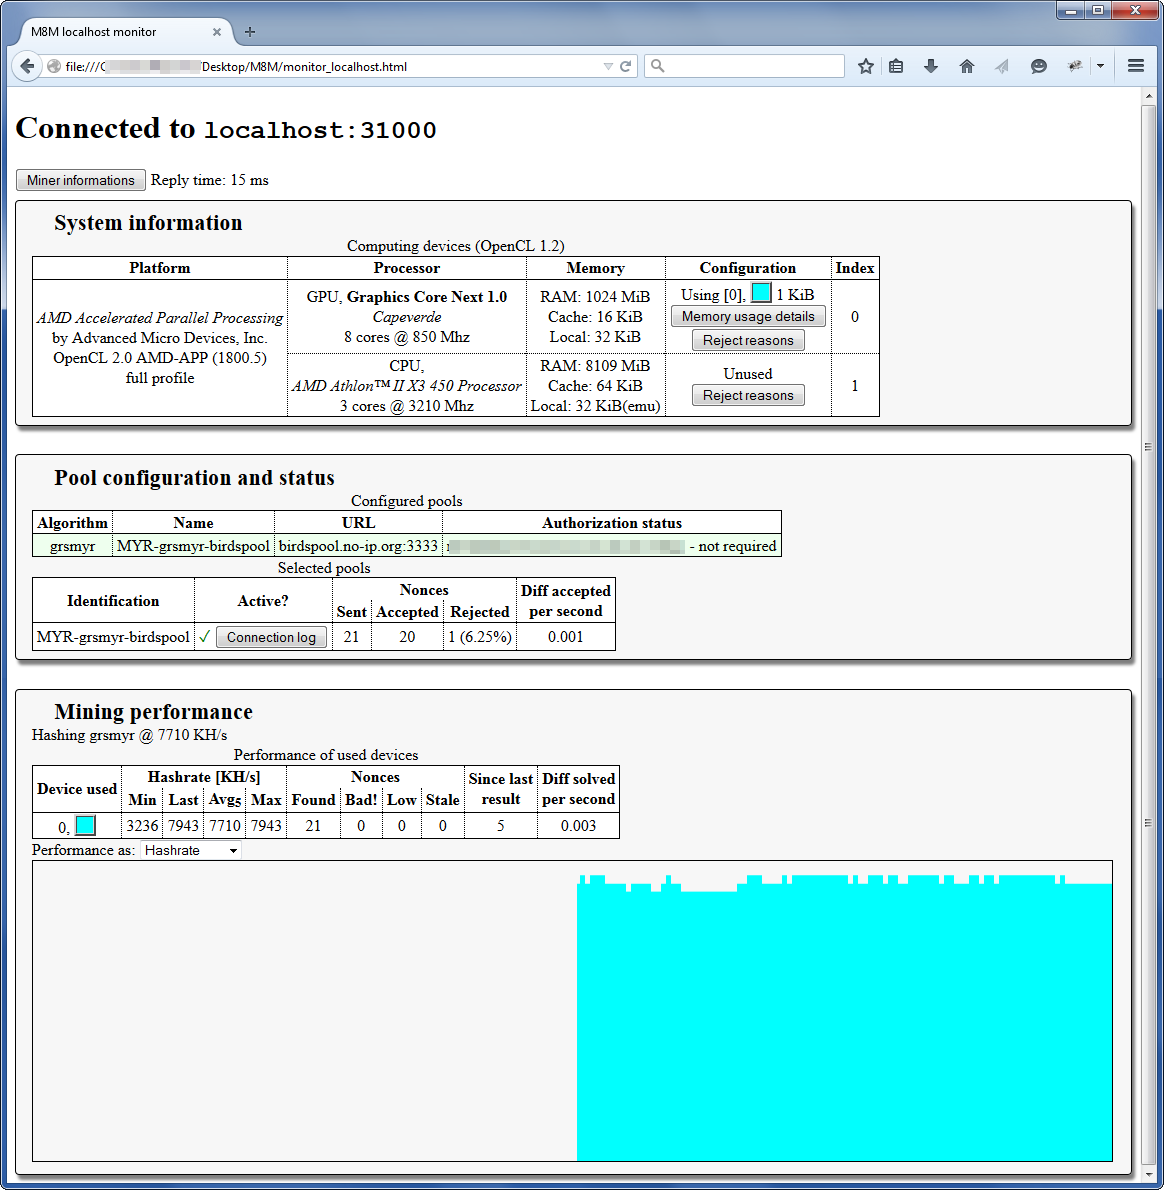
Holds static informations about the system, the computing devices, whatever they are used or not. If a device is not used, the program will tell you why. All devices, regardless being used or not, are identified by a unique index you can see on the right. Each used device is mapped to a configuration (identified by a number between square brackets). To help you track the various devices, each used device is given a color as well.
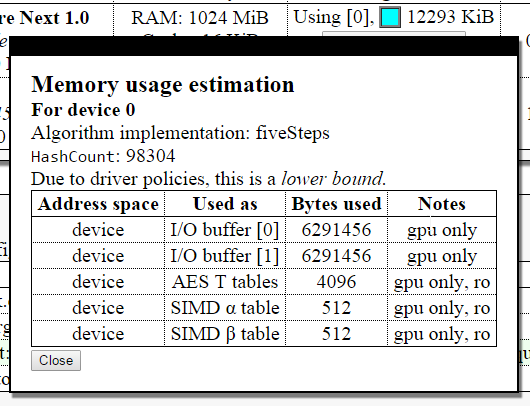
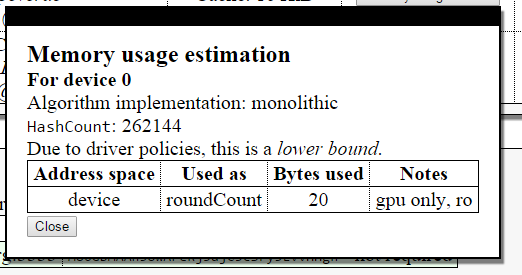
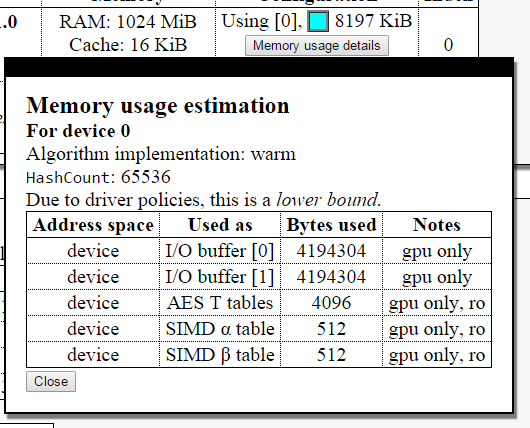
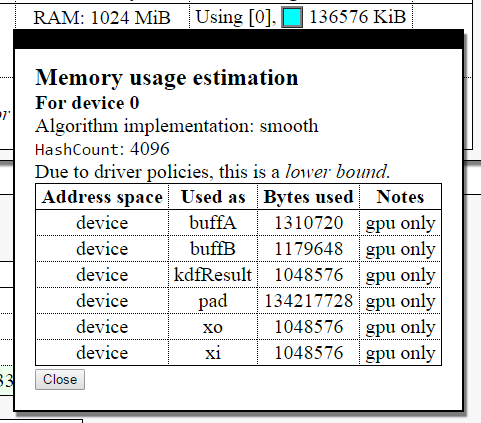
Once a device is mapped to a configuration, resources can be allocated. This is also a static property which can be inspected here; hitting the "Memory usage details" button will provide more detailed information. The reported information depends on the algorithm used; for example, see a report for qubit, grsmyr, fresh, neoscrypt.
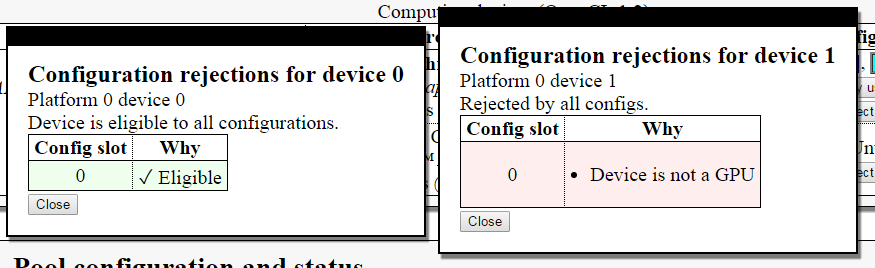
Clicking on 'reject reasons' button isn't much useful right now as there is no support for configuration requirements yet. In the future, this will help you in understanding why a certain configuration was used instead of another.
For the time being working devices will look like left box, while the non-working ones will look like the right one.
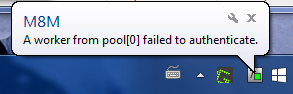
This section was added in 0.1.896 [Beta] in preparation for future improvements. The goal is to aggregate information on both a per-device and a per-pool basis, with this section focusing on the latter.
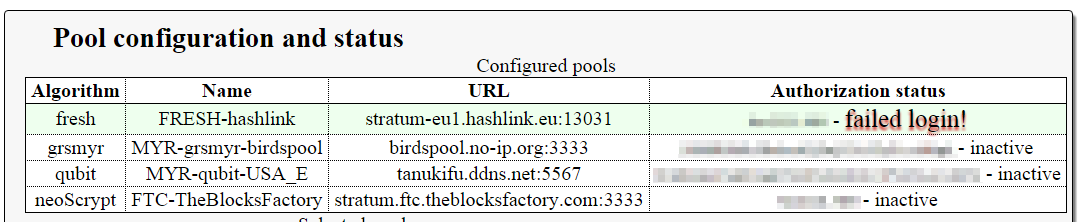
The first table gives a one line overlook for each pool specified in the configuration file. Each active pool will be marked with a light green background. For a slightly more useful configuration, it could look like:
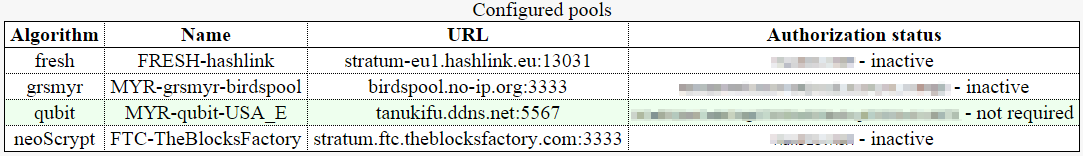
So you have the algorithm a pool is using, where all the pools whose algorithm matches the one you selected should be light green.
You then have the name, which is used below, the server URL and a quick overview of authorization status where login data (pixelated) is followed by result of authorization.
This information is almost static. It is possible to launch the web monitor before authorization takes place, in the case the data would be presented in incomplete state. Just reload.
The second table lists only selected pools (algo matches). In the second column, a green tick or a red X mark will signal if a pool is currently connected or not.
The sent column counts the amount of magic numbers sent by your miner to the pool: those are only a part of the found solutions - see mining performance for more info. If the pool considers those numbers valid it will count you a part of reward. Otherwise your contribution is rejected and counts nothing.
Let's talk about the Diff accepted per second column. With this, I am attempting to present you an estimation of net mining efficiency including all effects, approximating the amount of reward from the pool.
Pools will ask the miner to work at a certain difficulty. They want results with a difficulty at least 2, at least 8, at least 16.123. When a result has a value (sometimes called share difficulty) at least as high as requested, it is sent to the pool.
Here's the catch: the pool rewards the miner by adding the requested difficulty, not the true result difficulty. If pool requests values with difficulty at least 8 and you send a result which value is 42.123 you still get 8 rewards. Of course, if the pool fails to verify the number you get nothing.
When a block is found the pool considers those accumulated result difficulties and decides how much of block reward to distribute to each miner accordingly.
So basically, this number is the sum of requested difficulty for all accepted results. This is in contrast with the so called work utility used in legacy miners which increments whatever the result is accepted or not. Work utility was possibly introduced as a measurement of device mining efficiency but it just doesn't make much sense to me and I claim M8M to do this better.
I've left the "Connection Log" button last as this is seldom used. The miner monitor collects various information about connection status and puts them here so you can inspect connection quality and runtime. When your connection is stable and everything works, the contents are not quite interesting but as soon as the connection goes down the situation changes to something like:
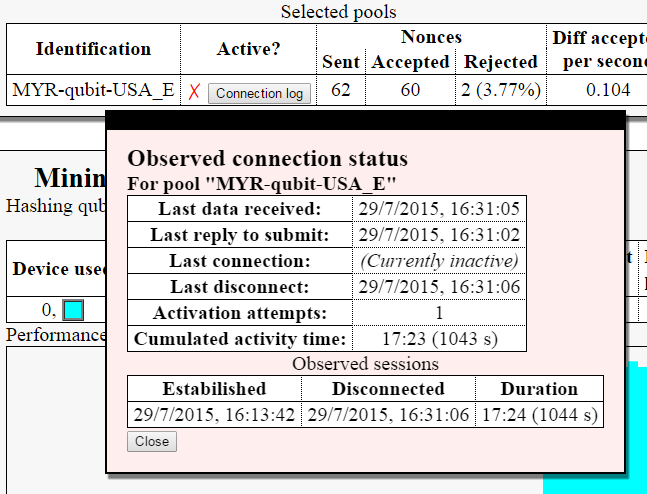
As this information is tracked by the miner monitor and not the miner itself there could be slight mismatches between the cumulated activity time (tracked by miner) and duration of the connection, as the latter is inferred by the monitor. It also means the connection log is gone if the miner monitor is closed.
This is the situation when a pool connection has failed. M8M will automatically attempt to reconnect after a few minutes and the whole thing will hopefully result to this:
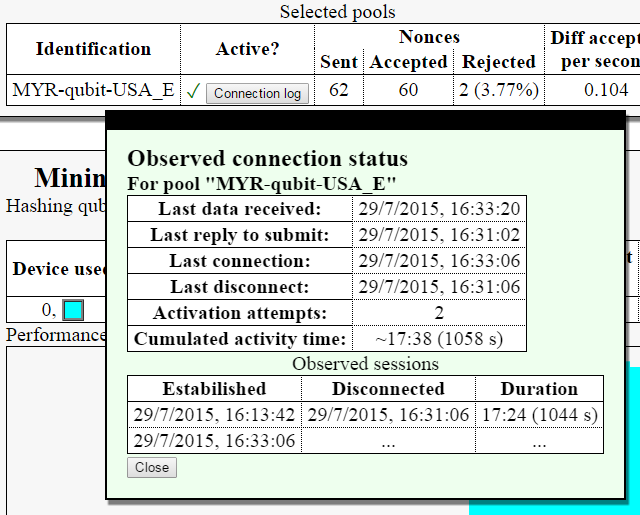
This looks pretty much like a pool which never failed. Each connection just adds a line to the table.
The delay before attempting reconnect is adjustable by config file.
That's what everybody cares about! As pool information has been moved out, this is now streamlined. It contains information about raw mining performance from the devices.
As a start, you get to see the currently running algorithm and the total aggregated hash rate from all (used) devices. This is probably the number you really care about.
Starting from 0.1.896 [Beta] this section also includes a crude stacked area graph scrolling 1 pixel each second so you can monitor performance stability. Again, this information is collected by the monitor so if you close it, it'll be gone.
The table contains a row for each used device. There isn't much to say about the columns Min and Max.
The difference between the Last and the Avg columns: when a result is found, the Last measurement is updated by the time required to run that specific iteration of the algorithm. It is an instant measurement, a single performance sample. The Avg column instead is updated every few seconds by just counting the amount of the iterations completed in the time frame, with no specific information about each one.
In general, if you want to measure how much time it takes you to make something, you just take a stopwatch and measure the time taken to do the thing. Since 0.1.896 [Beta] this table reports hash rates by default instead. You can revert to the stopwatch-like approach by using the combo box below the table. Why should you do that?
Measuring hashrate has two issues: first, it produces big numbers depending on the amount of hashes computed per pass. This is not particularly important and we could get along with it.
Most importantly, measuring performance in terms of "how much times I can do this thing in a second" is a non-linear property. Consider a task taking 1 ms. This results in 1000 iterations per second.
Let's make this ~20% faster, let's say it takes 0.8 ms. That's 1250 iterations per second. Note this is more than 1000 * 1.20. The division involved has somewhat "amplified" the difference.
Because of this reason, performance tools typically measure time taken plus the produced numbers usually have a nicer range.
Nonetheless, hashrate is used for aggregated performance as it can be added while iteration times cannot plus everyone loves it you get both accurancy and easiness of use.
The Nonces columns keep a count of "magic numbers" identified as potential solutions by the hashing process. When an OpenCL kernel computes something looking like a good result they send it back to CPU for validation, when the CPU picks it up, it counts it as found.
At this point, the CPU recomputes the magic number and checks the computed hash matches the one produced by GPU. If a mismatch is detected the result is considered wrong. This in theory never happens and is an indicator of some malfunction.
After the CPU matched the hashes, it computes difficulty and compares it to requested difficulty. As GPU only considers "a slice" of the hash it is possible and perfectly normal the true hash to be lower diff than expected. In this case, the pool won't reward it so it is discarded as low.
Then the CPU checks if the pool is still interested in results for the processed set of parameters. As of 0.1.896 [Beta] this is considered the case if the pool has not set any new parameters. This is cutting it a bit short as some pools (notably P2Pool) seem to be more permissive in terms of accepting result.
At the end of the day, results passing all those tests will be sent to a certain pool so sent = found - bad - low - stales.
Lastly, let's take a look at Diff solved per second. The problem is we want to measure device mining performance but as pools will send us difficulty adjustments we cannot just count the number of results.
This is in fact similar to the pool measurement Diff accepted per second but it counts the real computed "value" of each result considered valid and truly having high enough share difficulty. Whatever the result will be sent to pool or not is not very relevant by the point of view of the device, much less if accepted or not.
Nonetheless, as this counts the real difficulty produced it does not match legacy work utility either.
If you cannot connect to the web monitor first check out your antivirus. One particular vendor is known to be incredibly stupid in blocking connections with no notifications.
If this still does not work, or monitor is unstable try to contact the author because this should not be happening.

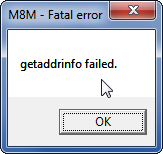
What happens: plenty of possible things. If this happens at startup, odds are you specified a wrong port for connection, some protocol violation happened and caused the server to kick you away.
It is a good idea to file a bug report or at least let someone know.
This can also happen every once in a while. It is known antivirus software has a part in it, but there are likely other causes as well.
Investigations started in 0.0.520 (Alpha) but were inconclusive; as of 0.1.896 (Beta) the issue should have been mitigated as a few quirks have been ironed out.
My first suspect is still AV/firewall software.